
Whole energy systems, composed and run.
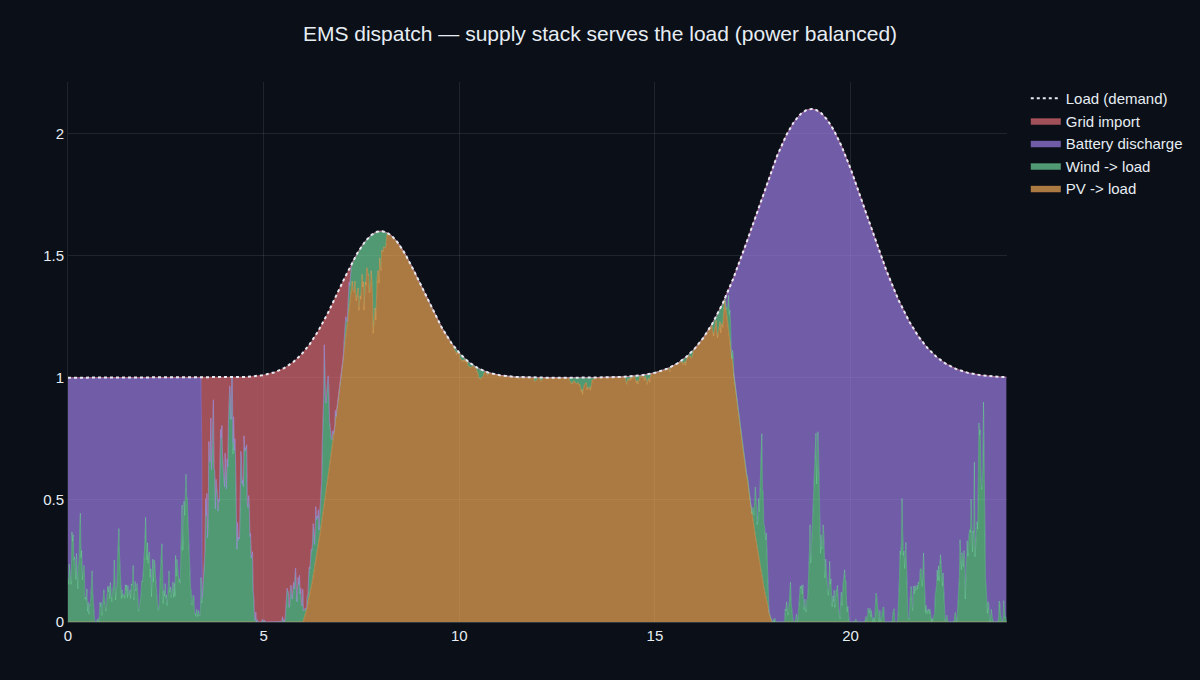
A microgrid isn't one component — it's a system: solar, wind, a battery, a grid connection and a load, all decided together, minute by minute, by an energy-management controller. This is the program that composes them. It models each source, wires them onto a shared bus, runs the dispatch over a day, and answers what an installer actually asks — how self-sufficient, how much peak shaved, what to size, and does it stay stable when it islands.
Five subsystems, one system.
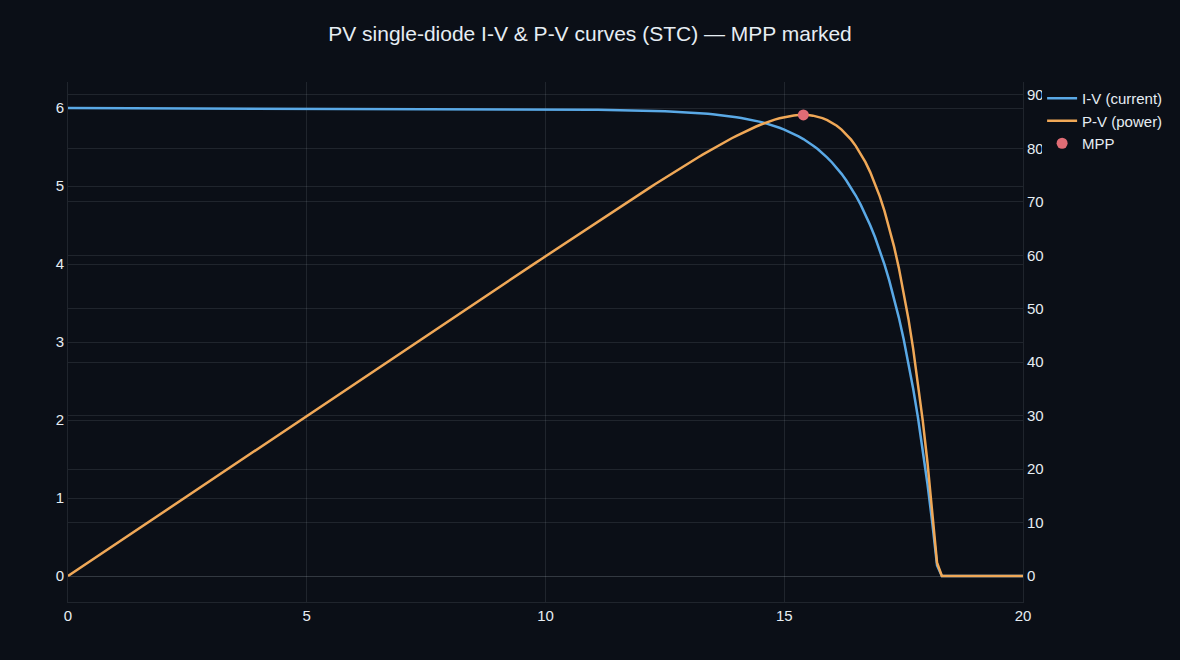
The microgrid is the clearest demonstration of designing a complete system from parts. Each subsystem carries its own physics — a single-diode PV array with its maximum-power point, a wind turbine power curve, an equivalent-circuit battery, a load profile, a grid tie — and they're wired onto one shared DC bus and solved together as a single acausal electrical network. On top of that bus sits the energy-management strategy that decides, every minute, where each kilowatt comes from and goes: PV to the load first, surplus to the battery, then the grid, then curtail; deficit from the battery, then import.
From half off-grid to almost off-grid.
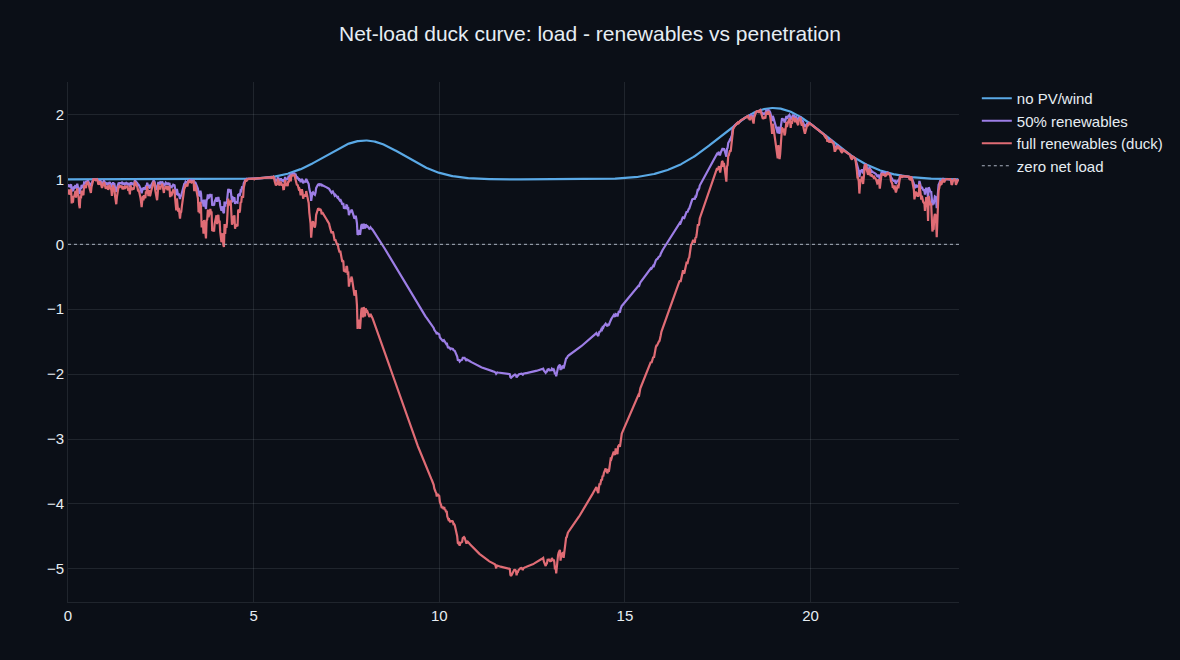
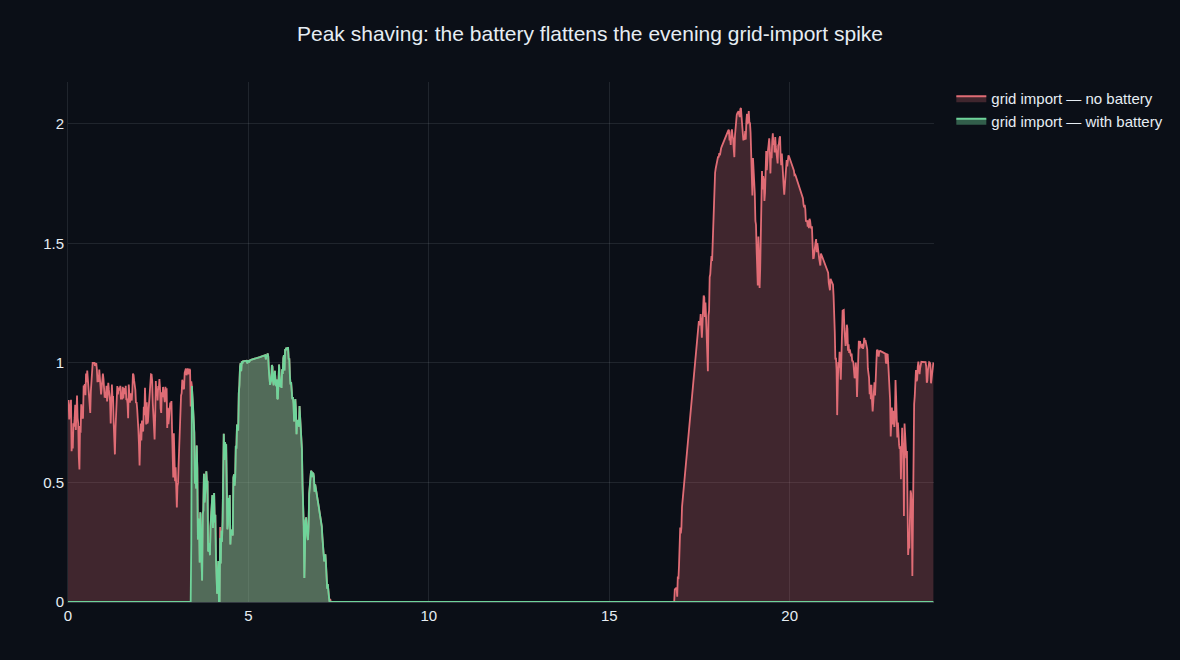
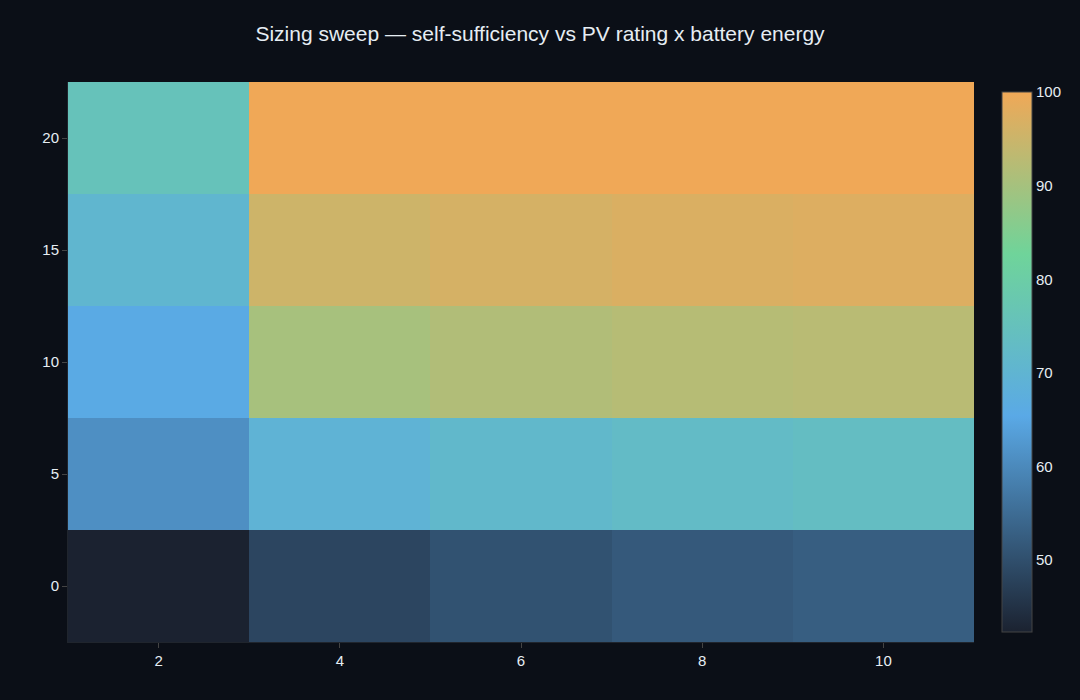
A battery turns a solar system from a daytime helper into a round-the-clock supply. Adding storage lifts self-sufficiency from 50% to 92% — the home draws from the grid only on the dullest mornings — and it shaves the evening import peak nearly in half, soaking up midday surplus and releasing it after sunset. The sizing study maps where that value saturates: the first few kilowatt-hours of storage buy the biggest jump, and there's a clear knee past which more battery barely moves the needle.
Holding the grid up alone.
Cut the utility connection and the microgrid has to set its own frequency. With droop control, each source contributes in proportion to its rating with no communication between them: a sudden load step drops the frequency, the sources pick it up in exact proportion to their droop slopes, and the frequency settles to a small, bounded offset within a second. It's the primary-control mechanism that keeps an islanded system standing — modelled here, droop slopes and all.
Every number is one you can re-run.
The sign-off notebook re-derives each requirement from the same dispatch the program runs; the composition .djl is confirmed solving through the canvas engine.
| Result | Requirement | |
|---|---|---|
| Self-sufficiency (with storage) | 91.6% | R-01 |
| Power-balance residual | 4.4e-16 kW | every step |
| Self-sufficiency lift from storage | 50.5 → 91.6% | R-03 |
| Evening-peak import cut | 48.6% | R-04 |
| Requirements verified | 5 / 5 | PASS |
Quasi-static dispatch, design-grade.
The dispatch is a quasi-static power balance, not an electromagnetic-transient grid simulation; the energy management is a transparent rule-based strategy, not an optimal/MPC dispatch; the islanded-stability notebook uses averaged primary droop (secondary frequency restoration is noted as future work); the daily profiles are synthetic and the economics indicative. That is exactly the fidelity microgrid concept and sizing need first — choosing PV, wind and battery sizes, designing the dispatch, quantifying self-sufficiency and peak-shaving, and checking islanded stability — on your own load and resource data, before a detailed EMT or optimal-dispatch study. And the DC-bus .djl shows the same system composed on a canvas.
Compose your own microgrid.
Book a walkthrough and we'll set up your PV, wind, battery and load and run the dispatch, sizing and islanding studies live.