
Hydrogen in, electricity out — and where the volts go.
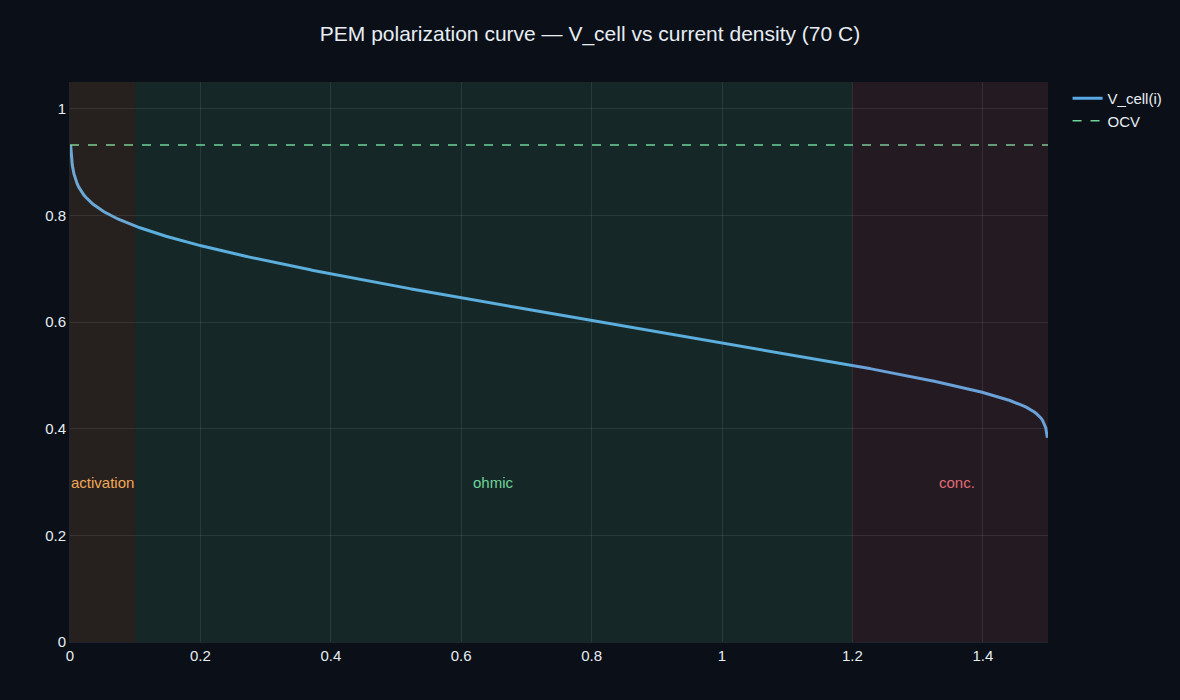
A fuel cell turns hydrogen and air straight into electricity, with water and heat as the only exhaust — no combustion, no Carnot ceiling. But the voltage you actually get is always less than the thermodynamics promises, and exactly how much less is the polarization curve. This program builds a PEM cell from its electrochemistry, traces that curve and the three losses that shape it, scales it into an automotive stack, and runs the fuel, thermal and dynamic behaviour a real system has to manage.
No flame, no Carnot limit.
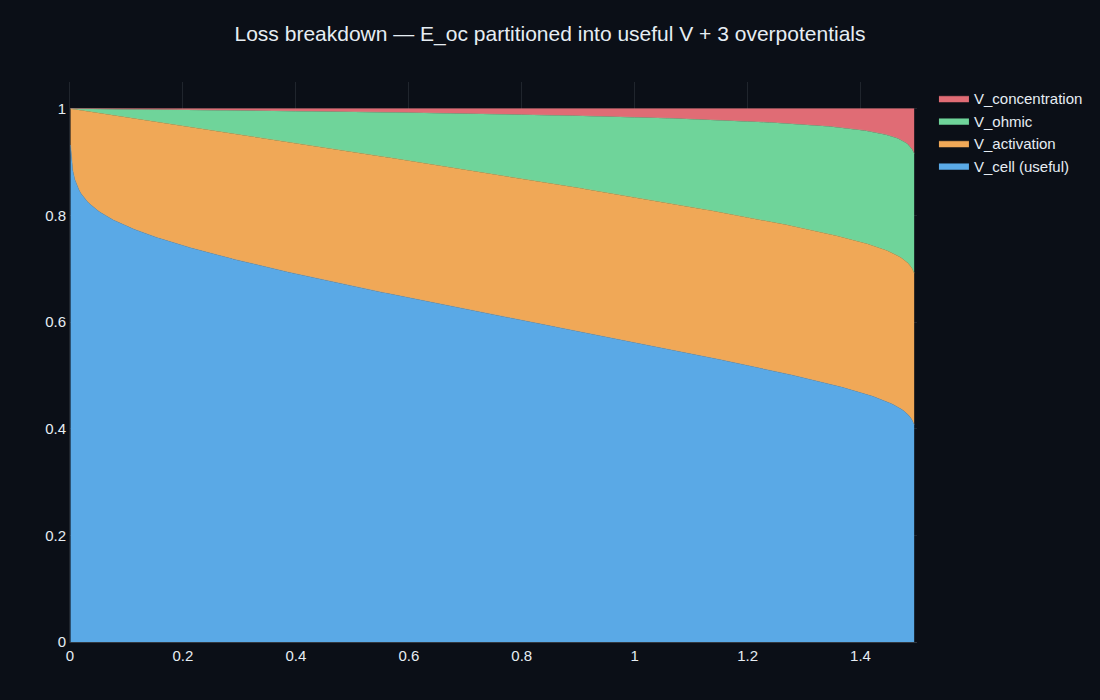
Because a fuel cell converts chemical energy to electricity directly, it isn't bound by the Carnot efficiency of a heat engine. The reversible cell voltage is 1.23 V and the thermoneutral voltage — where all the reaction enthalpy would become electricity — is 1.48 V, giving a thermodynamic ceiling around 83%. The catch is that you only see that voltage at zero current; the moment you draw power, three overpotentials start eating into it, and the polarization curve is the map of that erosion.
You can't have both at once.
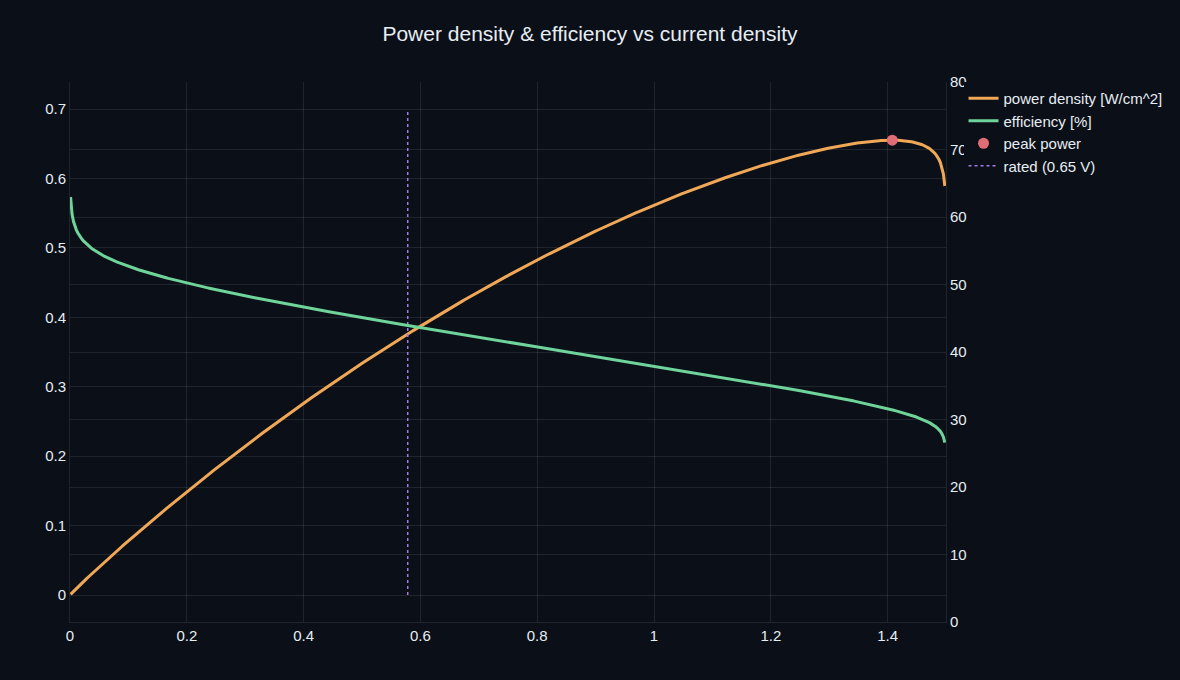
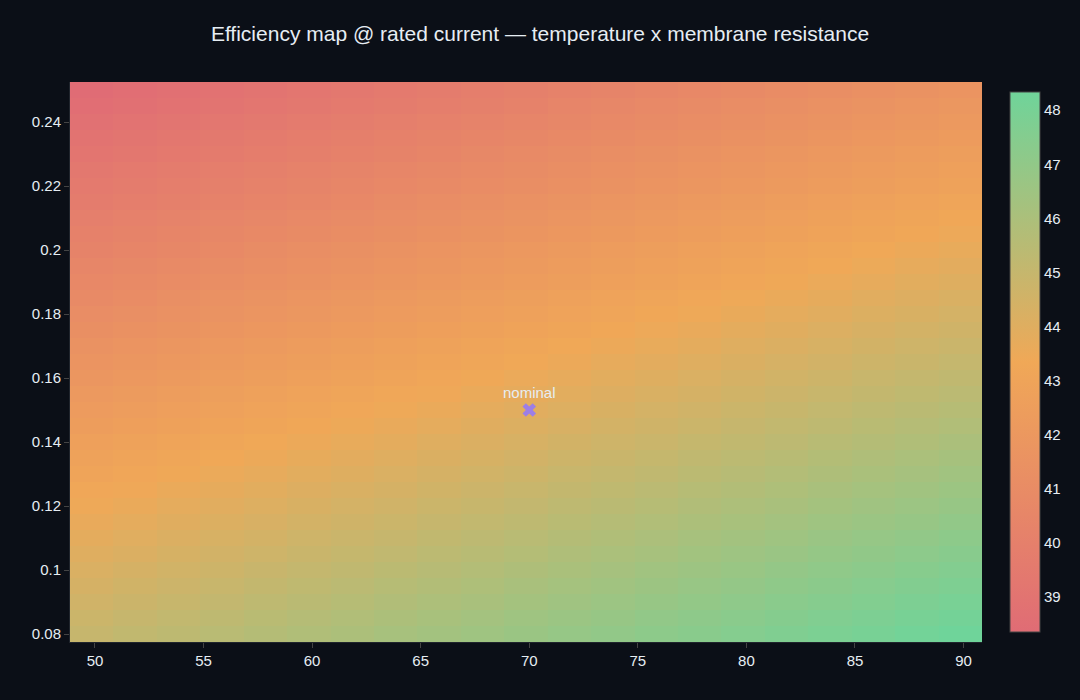
Power density is voltage times current, so it climbs as you draw more current — until the falling voltage wins and it peaks, here at 0.655 W/cm². But efficiency is just the cell voltage divided by the thermoneutral voltage, so it falls the whole way. That tension sets the rated point: run near peak power and the cell is small but inefficient and hot; run at high voltage and it's efficient but large. The program picks the rated point at 0.65 V — 43.9% efficient — and sizes the stack from there.
Every spec is a number you can re-run.
The sign-off notebook re-derives each requirement from the same electrochemical model the program builds.
| Result | Requirement | |
|---|---|---|
| Peak power density | 0.655 W/cm² | R-01 |
| Efficiency at rated | 43.9% | R-02 |
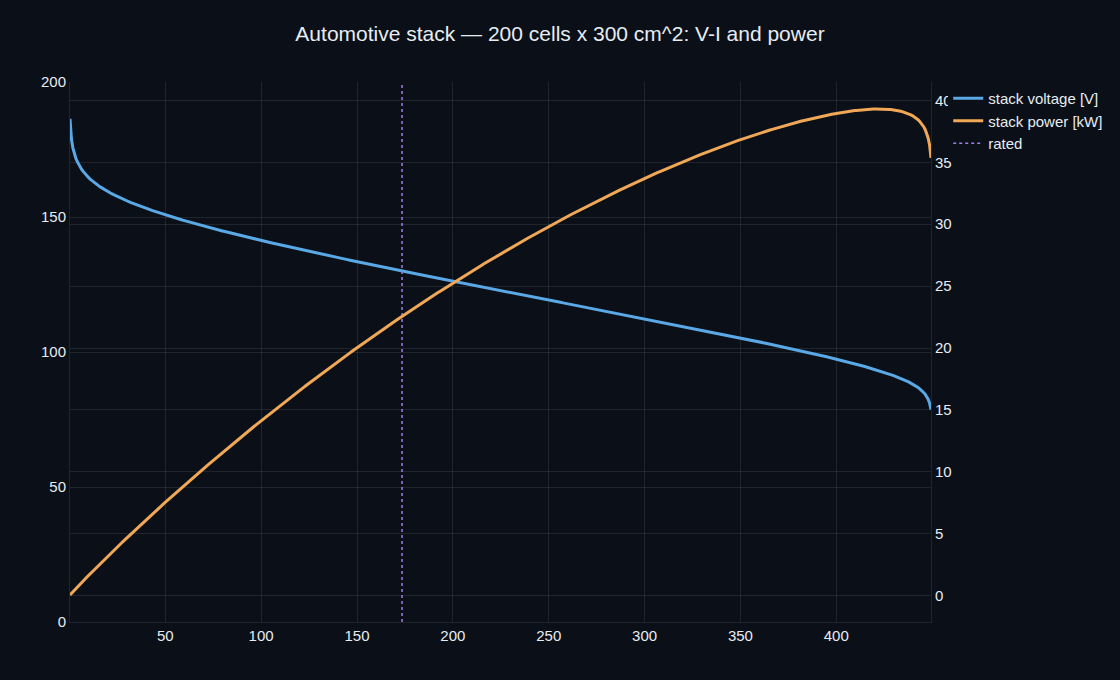
| Stack power | 22.6 kW @ 130 V | R-03 |
| Hydrogen consumption | 60.9 g/kWh | R-04 |
| Requirements verified | 6 / 6 | PASS |
0-D, design-grade electrochemistry.
The cell is a 0-D, semi-empirical model — Tafel activation, ohmic resistance and a concentration term — not a 1-D membrane-and-gas-diffusion-layer transport model; the thermal node is lumped and the stack is treated as uniform. That is exactly the fidelity fuel-cell sizing and system design need first: drawing the polarization curve, choosing the rated point, scaling the stack, budgeting hydrogen and cooling, and checking the dynamic response — on your own catalyst, membrane and operating numbers, before a detailed transport or CFD model.
Model your own fuel cell.
Book a walkthrough and we'll set up your electrochemistry, stack geometry and operating conditions, and run the polarization, stack and thermal studies live.