
A jet engine, from cycle to surge.
The Brayton cycle that powers every jet and gas-turbine plant, modelled as a single-spool turbojet: air is compressed, fuel burned, the gas expanded through a turbine that drives the compressor, and the rest dumped through a nozzle for thrust. The notebooks build it station by station, draw the compressor map, find the design point, spin the spool up, and walk into — then out of — the failure mode that defines engine control: compressor surge.
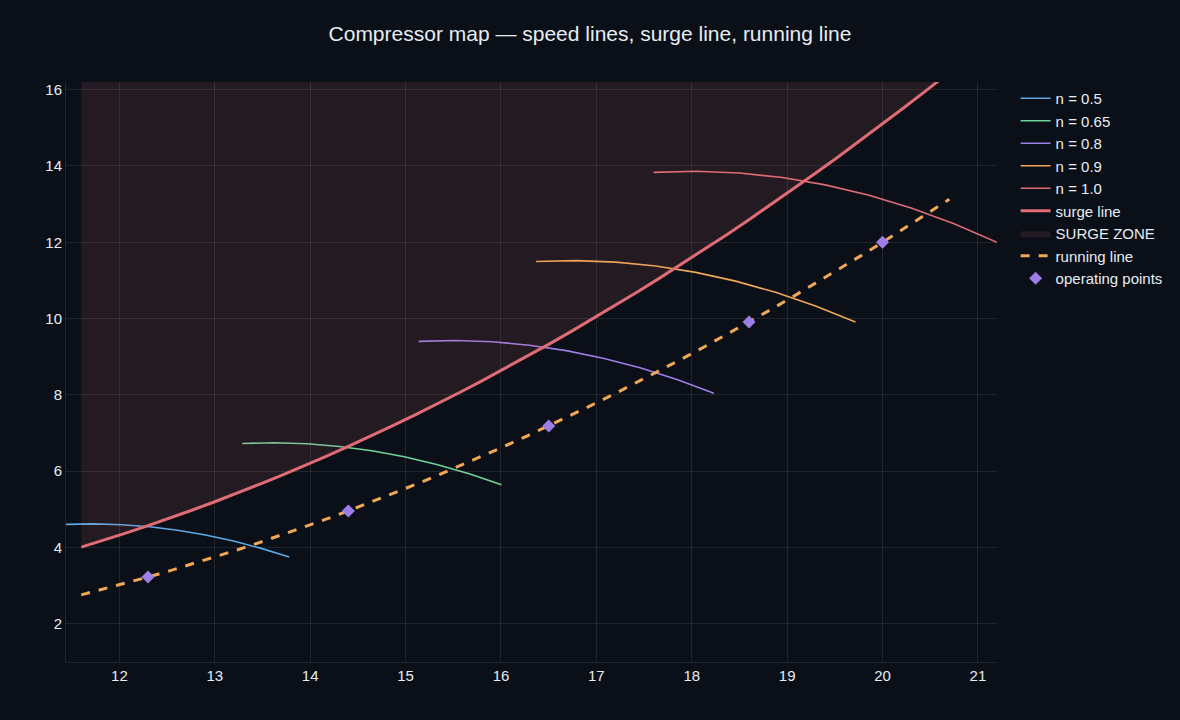
Five stations, one spool.
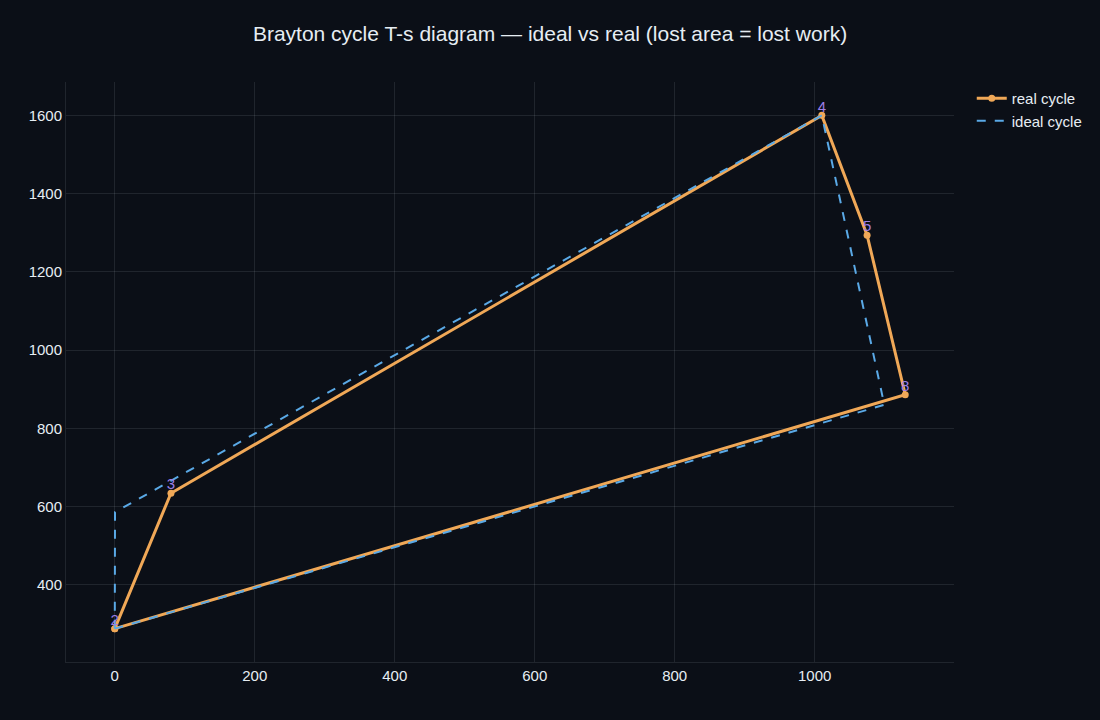
Air enters the inlet, the compressor raises its pressure twelvefold, the combustor burns fuel to 1600 K, the turbine expands the gas to drive the compressor, and the nozzle accelerates what's left to nearly a kilometre per second of exhaust. The one modelling point that makes a turbojet model right or useless: the turbine takes only enough enthalpy to drive the compressor — the work balance — which leaves a large pressure drop for the nozzle and hence real thrust. Prescribe the turbine expansion directly and the nozzle has nothing to work with and the engine makes no thrust; derive it from the compressor work and the design point lands at 19.2 kN and a textbook 23.8 mg/N·s fuel consumption.
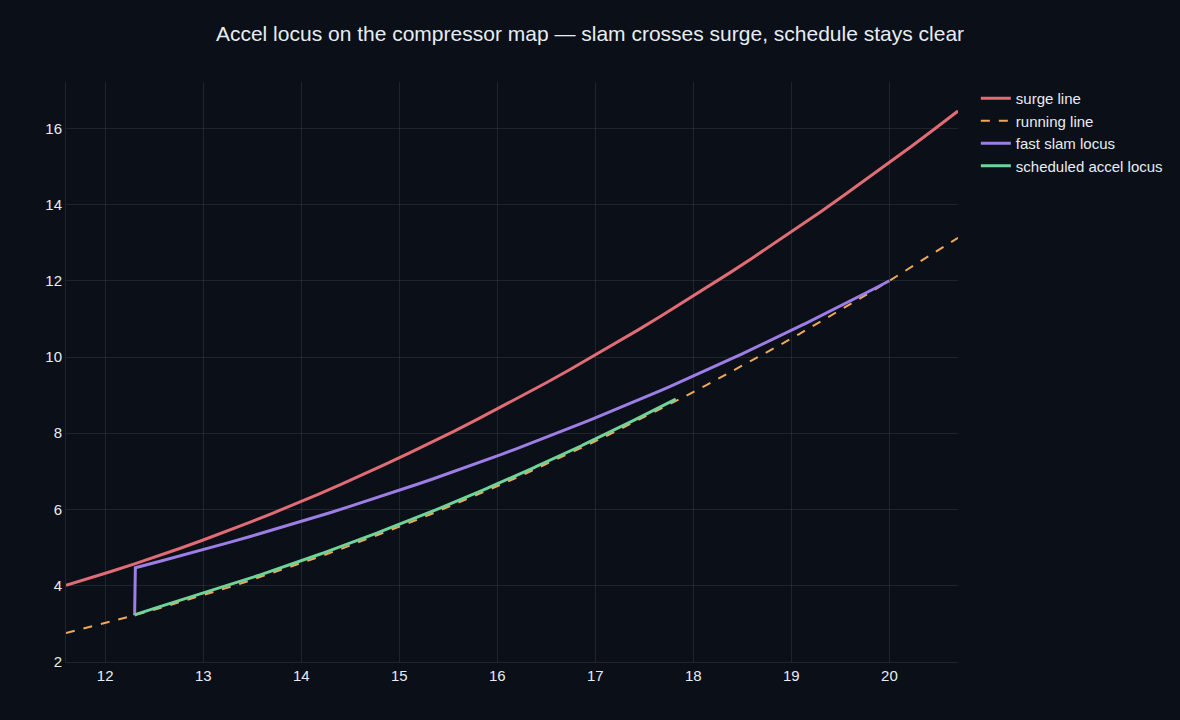
Why engines have an acceleration schedule.
Slam the throttle and the engine can surge — a violent flow breakdown that can flame out or damage the machine. The reason is inertia: a fast fuel increase spikes turbine-inlet temperature while the spool is still at low speed, driving the operating point up the speed line and across the surge line. The model reproduces it exactly — an unrestrained fuel slam collapses surge margin to −59.6%, deep in surge — and shows the fix every real engine controller uses: a fuel-rate acceleration schedule that keeps the operating point on the running line and holds the margin at +23%.
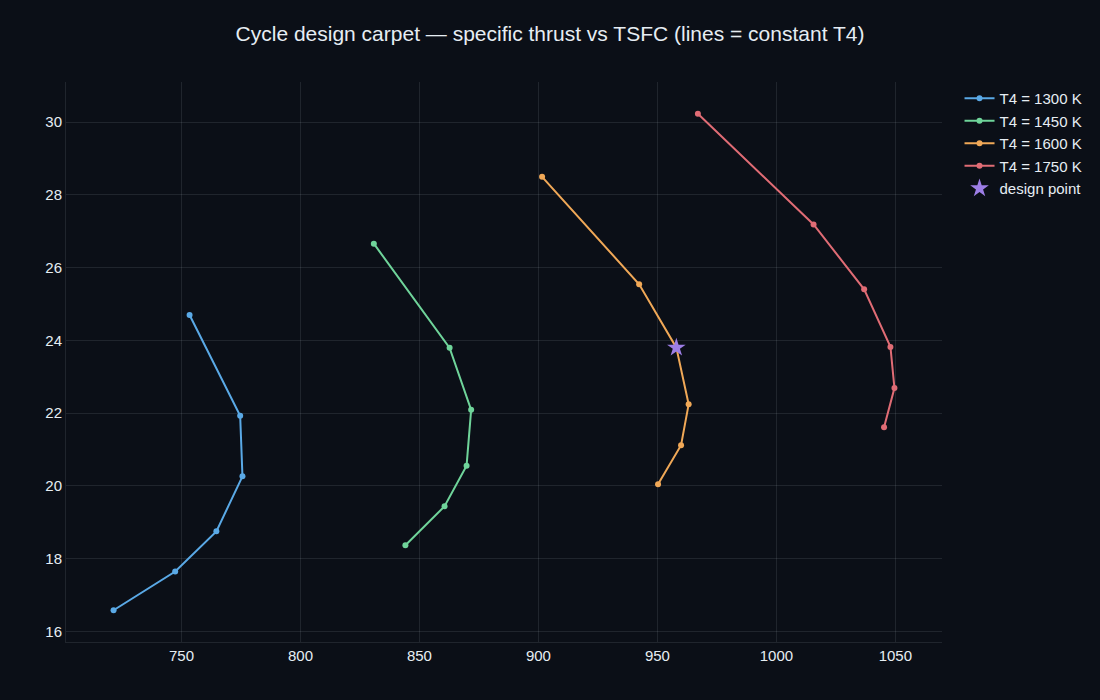
Every spec is a number you can re-run.
The sign-off notebook re-derives each requirement from the same gas-path model the program builds up.
| Result | Requirement | |
|---|---|---|
| Design thrust (SL static) | 19.2 kN | R-01 |
| Fuel consumption (TSFC) | 23.8 mg/N·s | R-02 |
| Turbine-inlet temperature | 1600 K | ≤ limit |
| Surge margin (scheduled accel) | +23.0% | ≥ 0, slam −59.6% |
| Requirements verified | 5 / 5 | PASS |
0-D, design-grade thermodynamics.
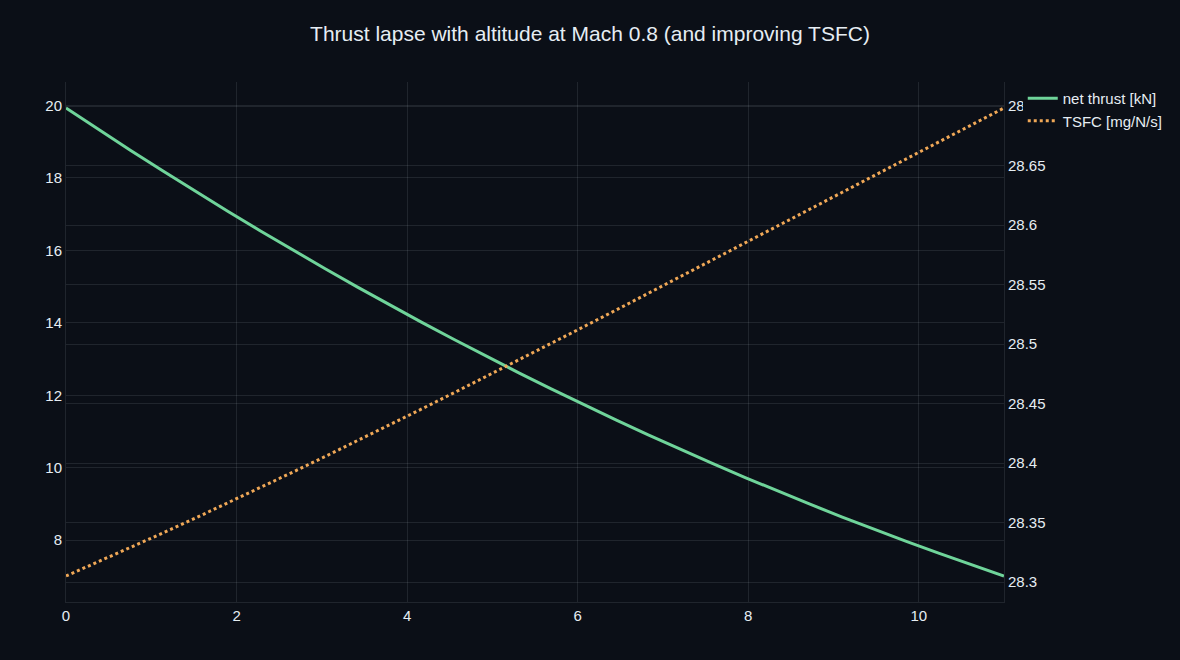
The engine is a 0-D / quasi-steady single spool, characterized by a self-consistent running line plus a surge line rather than a measured component map with beta-lines; the working fluid is ideal gas with cold and hot specific heats; the spool is lumped; the design point is sea-level static. That is exactly the fidelity preliminary cycle design and engine-control logic need first — sizing the cycle, choosing pressure ratio and turbine temperature, setting the acceleration schedule, and checking altitude lapse — on your own engine numbers, before a full component-matching or 3D aero model. Notebook-based; the cycle is causal, so there's no acausal network to compose.
Model your own engine cycle.
Book a walkthrough and we'll set up your design point, compressor and turbine characteristics, and run the cycle, surge and off-design studies live.