
Hearing a transformer fail before it does.
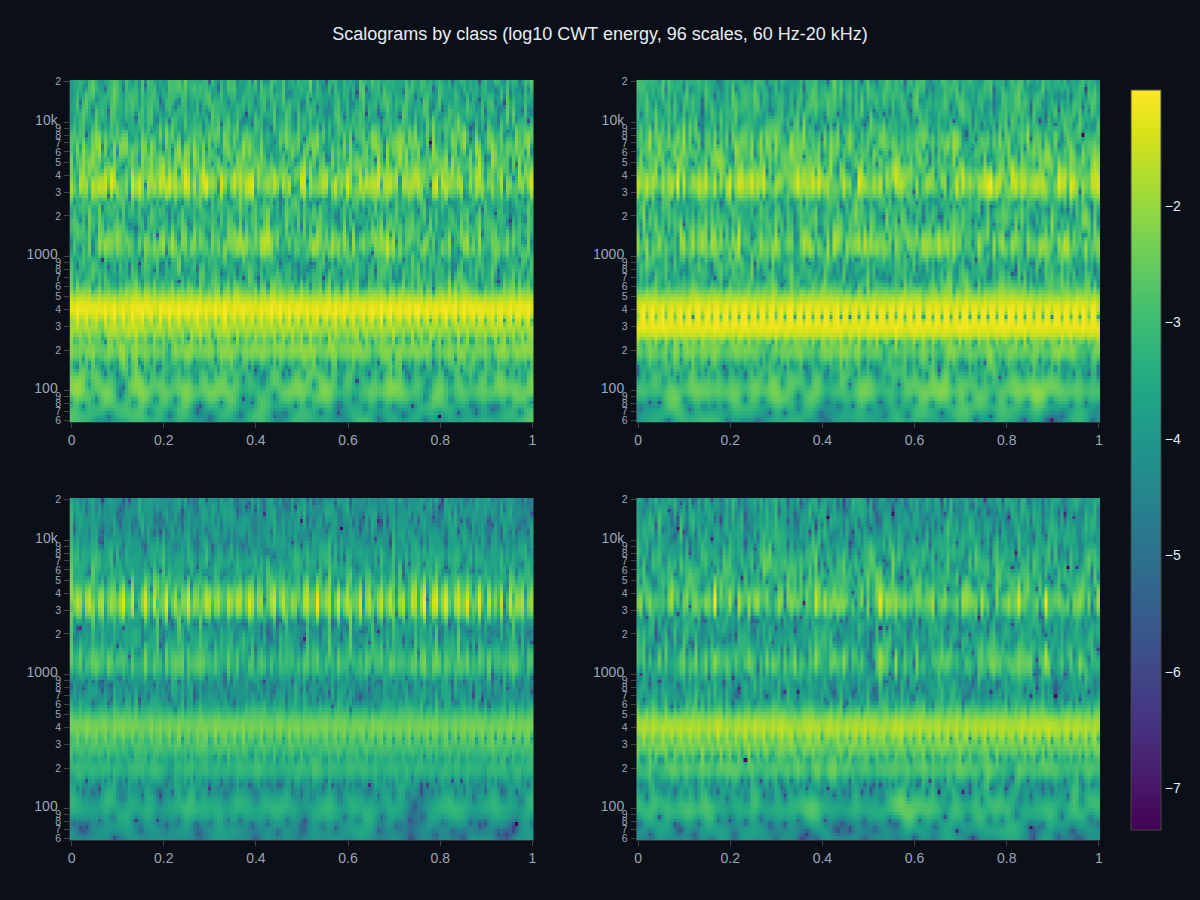
A single standoff microphone, three meters from an oil-immersed power transformer's tank wall, feeding a continuous-wavelet-transform diagnostic stack. Where a stationary Fourier transform blurs a microsecond partial-discharge burst across an entire averaging window, the CWT localises it to the millisecond — and a health index with honestly measured uncertainty and a remaining-useful-life estimate turn that signal into a maintenance decision, with the classes where wavelets don't help reported as plainly as the one where they do.
One thing here is synthetic: the microphone.
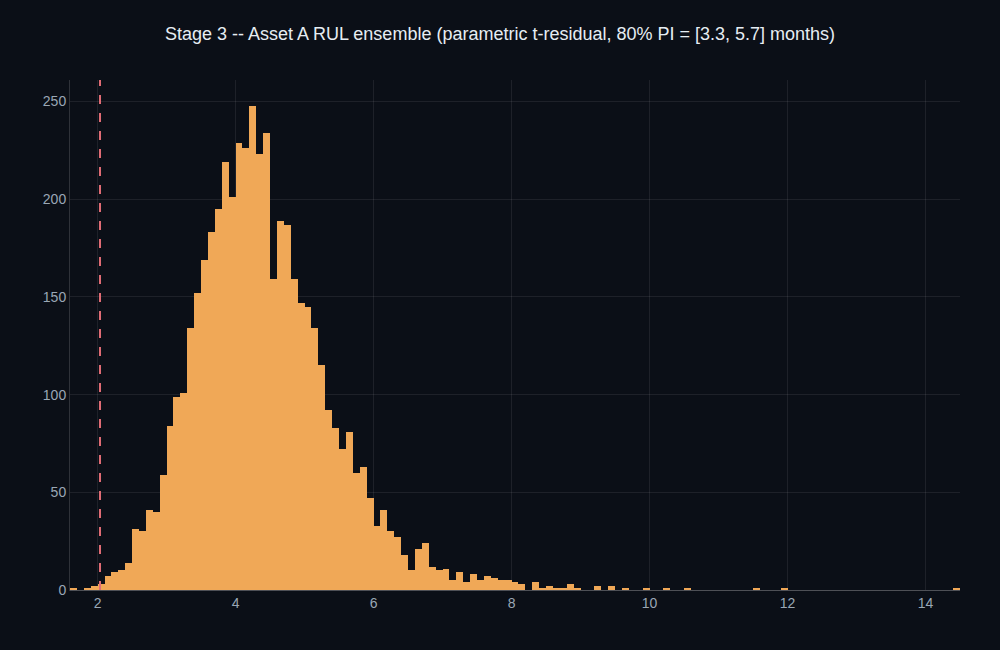
Every recording in this program is generated, not captured — a physics model of five acoustic mechanisms (core magnetostriction, winding Lorentz force, and three fault modes) convolved through a validated three-mode tank-wall transfer path, at a declared 8.4 dB broadband SNR against switchyard ambient noise. Everything downstream of that recording — the transform, the features, the classifiers, the health index, the prognosis — is real code operating on those samples; replace the recording step with a real sensor and nothing downstream changes. The health index's own 90% split-conformal interval, the gate built specifically to test whether its stated uncertainty is honest, covered 82.5% of held-out cases (n=63) — reported as a FAIL in the verification notebook and the program dossier, not rounded up. The remaining-useful-life trajectories are simulated monthly health-index snapshots from the same physics model, not longitudinal field data, so the 81.3% RUL coverage figure above is a property of the estimator applied to a simulated trajectory, not a claim about real transformer wear. No claim on this page substitutes for field validation.
Where wavelets win — and where they don't.
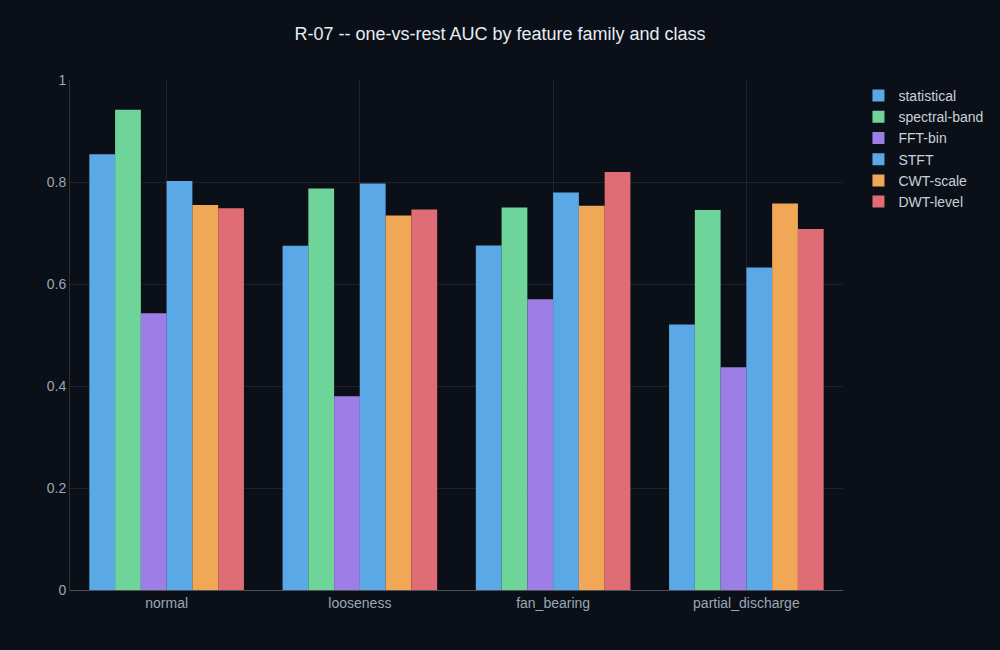
AUC values from notebook 06's held-out bake-off: one Mahalanobis-distance classifier, scored per class against six feature families on the same 234-record dataset (117 records fit each family's per-class Gaussian, the other 117 held out and scored — never both for the same record). The FFT column shows the strongest Fourier-derived family, spectral-band — consistent with how the R-07 gate itself is scored, against the strongest Fourier family rather than the weakest. CWT-scale wins the partial-discharge class outright among all six families measured — but spectral-band trails it by only 1.3 AUC points, short of the ≥10-point margin the program's own gate requires, which is measured as a FAIL, not rounded up. On the three stationary classes, CWT does not win at all.
| FFT | STFT | CWT | DWT | |
|---|---|---|---|---|
| Normal | 0.942 | 0.802 | 0.755 | 0.749 |
| Looseness | 0.787 | 0.797 | 0.734 | 0.746 |
| Fan bearing | 0.750 | 0.779 | 0.753 | 0.820 |
| Partial discharge | 0.745 | 0.633 | 0.758 | 0.708 |
Listen to your own asset.
Book a walkthrough and we'll drop in your acoustic signature and run the wavelet diagnostics, the feature bake-off, and the health-index / RUL pipeline live.